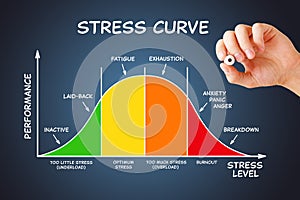
- Stock Photography: STRESS CURVE GRAPH DIAGRAM WITH DIFFERENT STAGES by Ivelinr
- Price: 1$
- Size Facebook: 1702 x 630 px
- Size Twitter: 1500 x 500 px
- Size LinkedIn: 1128 x 191 px
More Facebook, Twitter and LinkedIn Cover Photos
Cover photo info
- Photo title: Stress Curve Graph Diagram With Different Stages
- Author: Ivelinr
- Cover photo description:
- Hand drawing stress curve graph diagram with different stages from underload through overload and burnout and relation between performance and stress level
- Image ID:315456912
- Views:0
- Downloads:0
Keywords for Facebook, Twitter and LinkedIn timeline photos
anger
anxiety
anxious
background
balance
blue
breakdown
burnout
business
busy
concept
crisis
curve
dark
depression
diagram
disorder
distress
drawing
employee
exhausted
exhaustion
fatigue
frustrated
frustration
graph
hand
health
impact
job
level
life
management
marker
medical
overload
overwhelmed
overworked
panic
performance
pressure
problem
psychological
stages
strain
stress
stressful
syndrome
tension
text
tired
underload
work
workaholic
worker
workload
workplace
writing


